It’s official — public sector emails perform better than private sector emails
Granicus recently analysed the data of thousands of emails sent to UK subscribers via the govDelivery platform last year. As Granicus only works with public sector organisations, I can share some interesting stats and reveal the benchmarks for email engagement in the UK public sector. There’s some great news here – especially if you work in the public sector and want to get your important messages out to as many people as possible.
I’m happy to report that email engagement continues to rise. More people than ever before are signing up for updates from public sector organisations, and these organisations are beginning to use email for communications that are more than just newsletters.
How does the public sector compare to the private sector?
We’ve all signed up for email updates from private sector organisations —from special offers at your favourite pizza restaurant to a notification of when your dream home comes up for sale. Our inboxes are filled with emails enticing us to spend our money.
The private sector has used email as a marketing tool for many years. Email helps increase sales, drive awareness, and improve the customer experience. Private organisations see email as a primary communications channel as it has a much higher return on investment (ROI) than other digital channels.
Over the last couple of years, public sector organisations have realised the benefits of email for more than just newsletters —to change behaviours, educate people, and help deliver critical outcomes.
So… How do emails sent from public sector organisations compare to emails sent from private sector organisations?
The stats below were compiled using 2019 data. We’re seeing a huge increase at Granicus in open rates and click rates during the current Covid-19 pandemic, with staggering open rates of over 90% for customers sending their first email bulletins.
Public sector organisations have open rates that most private companies would love (and pay good money to achieve). While median open rate for the private sector is 21%, the median open rate for public sector is 33%. If we look at the top 20% of govDelivery customers, their open rate is higher at 46%.
In a world of disappearing budgets, the difference in a small percentage increase in open rates can be significant in terms of income generation. The more people opening your emails means more people learn about your services and take advantage of them.
It’s the same story with click rates.The median click rate of private sector emails is 2.5% and the median click rate for public sector emails is double that — 5%. If we look at the top govDelivery accounts, they are getting click rates of 9%. Once again, the more people clicking on your emails means a higher conversion rate — more online transactions, more tickets booked, more applications completed, more payments made, etc.
Why is this? Why is there such a difference in these email marketing metrics?
Is it because we have some truly amazing comms people in the public sector? Is it because people trust the public sector more than the private sector? Is it because govDelivery has a 99.9% deliverability rate and high open rates, which means that important messages don’t end up in spam folders?
Either way, those who aren’t taking advantage of email as a communications channel at the moment (and their willing potential audience) are missing out as there is a real appetite to receive targeted content via email about your services — yes, those 18 million people are waiting to hear from you!
2019 U.K. public sector benchmarks
Here are the 2019 email metrics for the UK public sector. We’ve listed the median rates for all organisations using the govDelivery platform, and we included the rates that the top 20% of organisations are achieving. How do you compare?
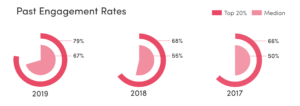
Engagement rates
What is it? The engagement rate is the number of unique email recipients who opened an email or clicked on a link in an email over a 90-day period, divided by the total number of email recipients who received an email during that time period.
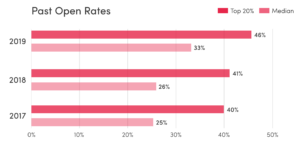
Open rates
What is it? The open rate is the number of recipients who opened an email compared to the number who received it.
Click rates
What is it? The click rate is the number of recipients who clicked on an email compared to the total number who received it. Clicks are a strong metric for engagement with your email content.

Let’s talk data
Learn more about how metrics can help you determine the effectiveness of your outreach. See latest U.K. benchmarks>>