Understand And Measure Community Sentiment
A few years ago, I attended a community meeting for government officials and community members to discuss a controversial issue. It was easy to measure the community sentiment, there was a lot of fear and anger in the room. Sometimes small steps forward in building trust are made by just being present and listening.
There was also a government note taker on stage; towards the end of the meeting, a community member asked to see those notes. This eagle-eyed community member had spotted the note taker wasn’t writing much. It transpired the notepad was entirely blank! The community ended up leaving the event even angrier than when they arrived with all their suspicions confirmed. There was little the government agency could do to convince the community they cared about their views.
With online citizen engagement, it is equally important to respect the community and take the time to measure and understand their responses as well as provide genuine feedback.
There are two ways to measure and understand responses: quantitative data and qualitative research
Quantitative Data
The statistics give us a broad overview of the engagement. This data shows what the community is most interested in, how the community is feeling and the depth of interest in an issue.
Most websites measure activity using Google Analytics. Google’s analytical tools are not designed for citizen engagement and focus on metrics more useful to marketers.
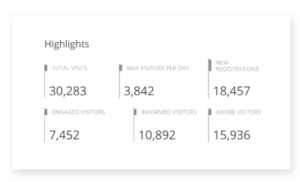
EngagementHQ measures community sentiment with Aware, Informed and Engaged cohorts.
- Aware includes everyone that has visited a site.
- Informed includes all site visitors that clicked a link to learn more.
- Engaged includes all site visitors that provided some kind of feedback via comments or posts.
Below is a report snapshot of how this information is presented (the data comes from our demo site because our clients own all their data).
We advise our clients to set targets and measure the success via these metrics. It is also important to target cohorts based on the objectives of the project. For example, a visioning process asking the community for ideas about the possibilities for the future is clearly targeting a high ‘Engaged’ cohort. The exhibition of a draft strategy, on the other hand, is targeting an ‘Informed’ cohort because we know the community only becomes engaged in large numbers when they want to see change. Therefore, a fantastic draft strategy will most likely attract interest but not a huge amount of comment.
I worked with a municipality on a potentially controversial planning project a few years ago. Their online consultation had over 13,000 visitors with over 8,000 people downloading the relevant documents but there were only 8 comments in the discussion. The face to face engagement process yielded similar outcomes. As a result, the municipality was able to measure their community sentiment as broadly supporting the plan.
We have to be very careful with our words here. An individual who visits a website, reads the relevant document and does not comment cannot be said to support something, all we can say is that they are informed. But, we know from thousands of projects over 8 years that when large numbers of people are informed that many will become engaged if they want to see change. It is possible to make judgments about the behaviour of a crowd in this way that cannot be applied to an individual.
Confirming community sentiment can be done by conducting a brief follow-up survey among those who visited the project if needed.
It’s also important to understand site visitor activity; which photos were viewed, which videos were watched and which documents were downloaded among other statistics. This data builds a picture of the information most relevant to the community.
Your measurement should also allow you to dig into demographic subsets of your respondents to ensure that you are hearing from a representative cross-section of the community. If you find your responses are not representative then use face to face engagement methods and publicity about the opportunity to engage online to reach out to these under-represented groups.
Measure community sentiment is with qualitative research
This means gathering and respecting all community responses. In many ways engaging online helps with this right off the bat. We’ve all been in meetings where someone gives an impassioned speech only to see it summarised by the facilitator into 2 words on a white board. Online engagement gives community members the opportunity to craft a statement and to have it recorded exactly as intended.
How do we analyse this qualitative feedback? Our approach is to add tags to individual contributions. Tags can be allocated according to the sentiment or issues raised and are a very flexible effective way to analyse data. Data can then be sorted for different issues or sentiment settings or to see what issues are being raised by different demographic cohorts.
To gain an accurate picture of how communities view an issue, it is important to measure and analyse all participant activity with citizen engagement parameters in mind. This is respectful of community contributions and will ensure you have a complete picture of community views and sentiment.